
A Comprehensive Framework for QAing Digital Analytics
Sep 15, 2019 | 24 min readThere is often an overlooked area of digital analytics called Quality Assurance (QA). Often the “unsexy” side of software engineering, QA is extremely important and can make or break a business and drastically affect the launch of an analytics project. This not only delays projects and timelines but bad data also introduces trust issues into the teams managing that data and any of the analytics that is run on top of that.
Over the last few years, I have learned that a lot of data on the web is collected in a similar way and that we can use a simple framework to understand and debug these collectors. I will be speaking to the specific realm of digital analytics because that is what I am currently using my core skills for. Most modern sites will be using a tag manager and data layer configuration to collect their digital analytics data.
There are other methods to collect data outside of a tag manager and data layer, but it is one of the most common methods used today. Historically we have hardcoded analytics into our website but with tag manager, we have abstracted that out and this has allowed for analyst, marketers, and developer to collaborate to deploy tags and collect data in 1st party and 3rd party analytics systems.
To start I wanted to share a diagram I use to communicate how tag managers work.
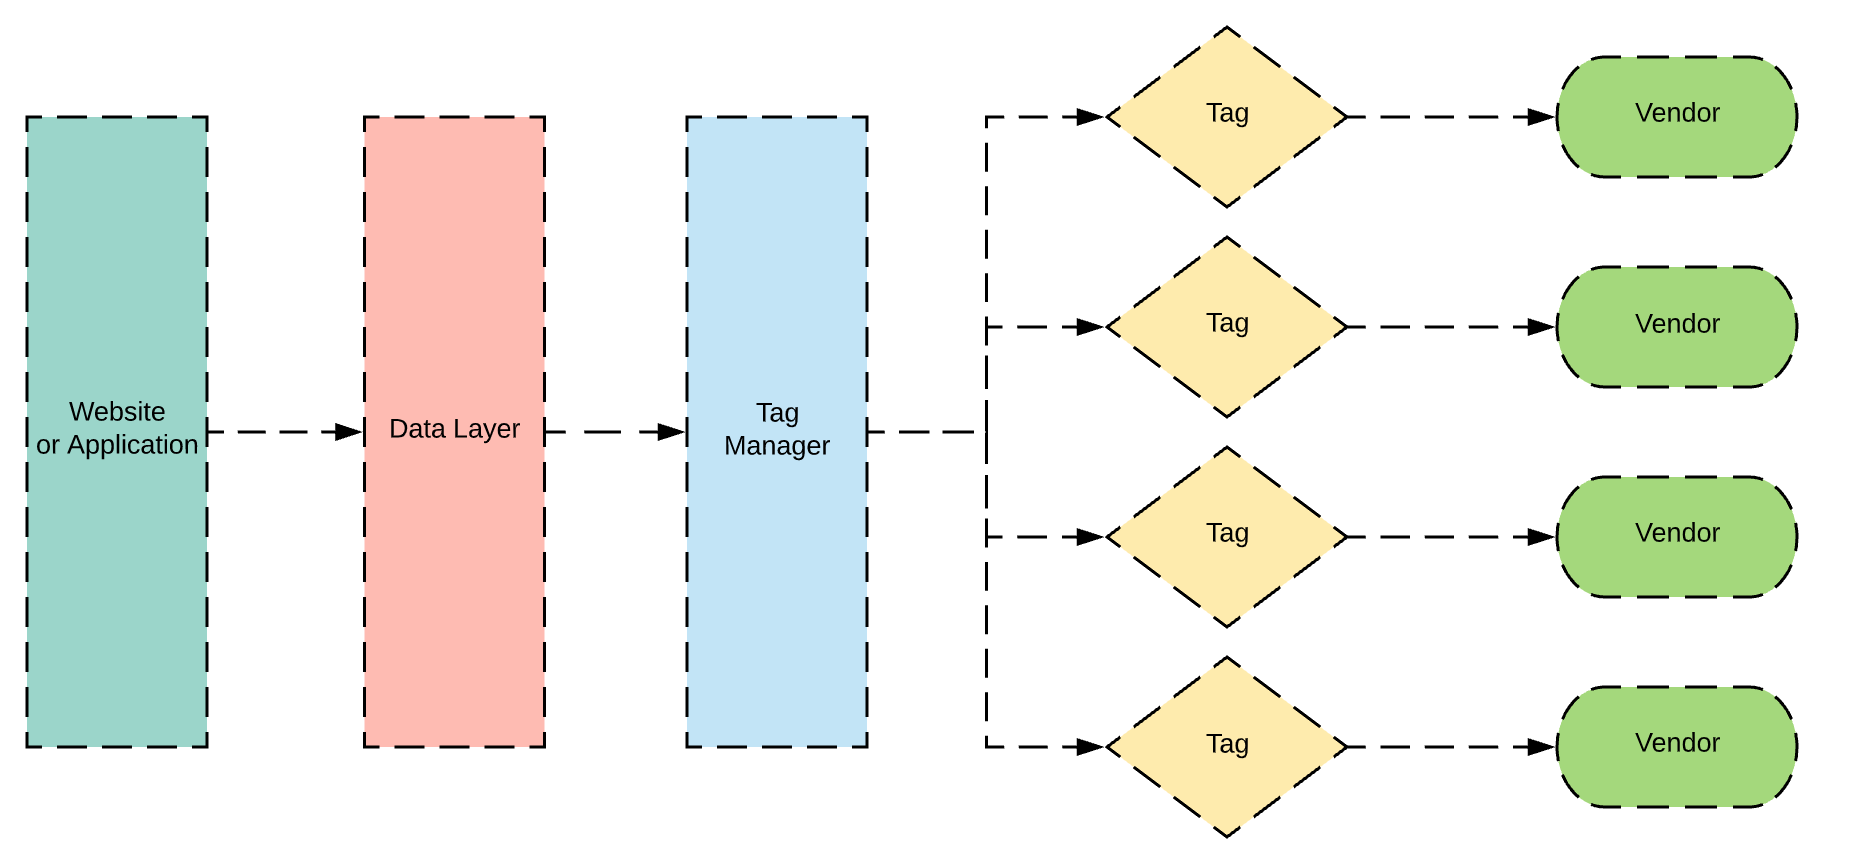
The website or application is your website or web application like your e-commerce store, blog, lead generation site, or product. This is normally built by your IT team or development team.
The data layer is a persistent javascript object the contains data that you want to collect and send to vendors This could be actions users are taking on your site like clicking a button, viewing a page, or scrolling. It also can contain user information like email address, demographics, or user IDs. This layer of information contains your business’s most important business logic and valuable data to describing important user actions and attributes about the user. There are lots of conversation going on with what is the best way to build a data layer and how much information should be going into it but I will save that for the #measure community to debate. A good place to start with researching a data layer is the W3 Community Customer Digital Data Layer.
Next is the tag manager, there are a lot of different platforms that you can use for tag management. Here is a decently comprehensive list of tag managers. A tag manager will contain snippets of javascript that will either communicate with the data layer, modify the user experience, or send data to other platforms.
There are also lots of guides on how to set up your tag manager and the best advice I have heard is if you have the chance to do something with the UI, do it. This can easily turn into a tool where 6 different ’ logic and coding philosophies get smashed together. Then when you try to fix something you have to try and understand why someone used a jQuery selector here, a data attribute and a rule there, and a hardcoded rule nested deep in custom javascript there. A tag manager is meant to take the data and business logic that goes into the data layer and use that information to communicate to other platforms or modify the experience for the user with personalization or A/B testing. There are a ton of vendors that want to receive data from your website and each site will be different because your marketing efforts, personalization, and various analytics platforms.
Now to ensure that all of these systems are working properly, I like to break up my QA process into four stages and each tech stack will have slightly different workflows but they can all follow this basic framework. On a side note, all of these processes can be automated and put into your unit testing but it is important to understand all the different layers to know how data is tagged, collected, and processed so you can find out where the issues are. A lot of the time I will be working with someone that only specialize in one part of the collection pipeline of digital analytics tools and their focus would only be on their area.
Hopefully, with this framework, every person that touches the analytics development cycle will have a basic understanding of how data flows between all of these systems and it will it make easier to identify where there is a bug or bad data. Even though you should test your analytics in all browsers, I primarily do my testing in Chrome so I will be speaking to that mostly. There are generally equivalent tools for each of the features I am describing.
After you have your tags ready, either in a Preview mode like GTM or in a staging environment, you can start to move through the various stages of the QA process. Similar to the way data flows through the various components, I use that same data flow to determine my QA process.
Some basic ideas you will want to understand before moving through this next section are javascript variables, APIs, arrays, objects, server-side vs client-side and the Chrome DevTools.
Javascript variables (info) - a variable that holds some type of data that can be changed at any point.
APIs (info) - API stands for Application Programming Interface. An API typically is used to communicate with some type of application, either to send it information or retrieve it. For example, your website might have a database of users, through an API it is possible to retrieve and set that information in a javascript variable so your tag manager can use it.
Array (info) - an array is a list of values that is stored in a javascript variable.
Example:
var students = ['billy', 'jane', 'brett'];Object - an object is a key-value pair collection of data.
Example
var student_data = {
  name: 'billy',
  age: 12,
  specialty: 'putting wood chips in water fountains',
  powers: 'never getting wood chips in his shoes'
};
Server-Side: (info): Code typically runs in two places, the server or the client. Server-side code runs in the background typically on another server outside of your computer. This is where databases are stored and maintained. If there is data that is rendered from the server to the datalayer it will either be served up through an API or saved in some sort of variable on the client in localStoage, cookies, or on the DOM. Example of this is php and python.
Client-Side (info): This is typically your browser or local computer. Client-side code will run in your browser and typically will interact directly with the DOM or HTML. Data points that come from client-side code are derived from the APIs from the browser.
Chrome DevTools (info): There are a lot of different functions and tools in the Chrome DevTools but the two I primarily focus on are Console and Network. In the Console you will be able to run javascript and examine variable that has been set. The Network tab is where I examine the data points that tags are sending to their vendors. This tab help see all the layers of data that is being transferred to and from the site.
My Flow:
When I am working on analytics implementations, I use the same flow that the data moves through for my QA process.
datalayer → tag manager → network log → analytics application
First Stage - Data Layer
I start with the datalayer, because that is the first component to linking application generated data with the tag manager. Generally, the data layer will be called digitalData, dataLayer, or utag_data. You can always ask the developer the variable name. The easiest way to look at the data layer is in the console tab of the developer tools. After opening the console and opening the javascript variable for the datalayer, I will do a sanity check. Does everything make sense? Are there any NULL values that are supposed to have data?
Here are also some tips I use when looking at this important component:
- Watch when certain data is pushed to the data layer. It is important to know what part of your data layer is being powered by certain APIs. For example user information might enter the data layer at a different point because it has to make a call to an API. If a tag was fired before that data was there, then that row of data might be missing an important value.
- Look at the common variables like page URL, user IDs, user agent, or referral URL. If the page URL has parameters on it, your tag might be picking up those URL parameters.
- Keep in mind race conditions when observing the data layer, if a tag is depending on a piece of data or will trigger off a piece of data entering the datalayer there is a chance it will be missing.
- Have in mind the general code that is setting data on the datalayer. Generally there are two ways that data gets set, server-side or client-side. You can typically ask your development team whether that data point came from the server or the client. As you get more familiar with your particular implementation, this will become easier. This matters because sometimes you will have to track down what code is supplying that specific data point to debug or understand why it is generating incorrectly.
- If you need to find the specific code snippet that is generating the datalayer, use Chrome’s search function to local specific values. Look for either the object key-value pair or the function that pushes that specific element onto the data layer like
dataLayer.push({'pageURL':.
General Advice
The best advice I have been given for data layers is to make them tool agnostic, don’t build it for your specific tag management solution. That will come in handy if you would like to switch tag managers later on. So often we build a data layer to a specific tool and it will require us to rebuild it if we want to switch tag managers.
The data layer is a fundamental piece of technology for any business and it needs to be treated as such. There are a few different philosophies on building this but what is important is to document how it is built. The key is every part of it can be mapped to a business objective. Personally, I keep a spreadsheet of every piece of data, map it to a business objective, and then some general notes of where the data is coming from.
Some tools that are helpful for looking at the data layer are:
Second Stage - Tag Manager
After looking at the data layer, I look at the specific tag that I am testing. At this point it as simple as making sure that the tag manager is loading correctly and not throwing any javascript errors. ****To make it easier to manage, I will only work on a few tags at a time. When you are looking for javascript errors, this is also a time to make sure your libraries are loading correctly.
Some common issue are:
- Incorrect account IDs, make sure you are using the account ID that was given from code snippet.
- Tag manager is referencing the incorrect variables in the data layer.
- Race conditions might be affecting how your tags are firing. If a tag is waiting for data that there is a chance that the tag will not fire or it will fire with partial data.
- Sometimes you will be waiting for data from an API and it might be slowing down your tags. Try to avoid making your tags reliant on slow APIs and if you do need that data store it in local storage or as a cookie so you don’t have to keep making a call to the library. You can use the network tab in the dev tools to see when certain calls are going on.
- Single Page Applications (SPA) can cause issues If you do not have the logic wired up correctly. A lot of tag managers are meant to work with traditional websites that refresh when a new page loads. With single page apps you don’t have that benefit and will need to have a mechanism that simulates a pageview. There are plenty of blog post about this for each specific tag manager.
- Landing page redirects might be affecting how the tag manager is loading.
- Take advantage of specific extensions for each tag manager. They often will let you know what rules are loading that trigger specific tags to fire. You can find a list of those at the bottom of this post.
General Advice:
Get to know what rules you are depending on to fire tags. I like to separate out my tags into three categories based on the type of data being sent: loading library, pageview, and event. If you have these three separated, it is easier to debug what is going on with the code. As we move into a newer age of applications and analytics, the idea of separating out pageviews and events will go away and the page view will just be another type of event but currently a lot analytics libraries split these out into separate functions, hence the reason I split them out. When you split them out you are easily able to add console.logs or other debugging mechanisms. Not all tag managers let you easily do this and the UI might not allow for it but if you mentally break up a tag anatomy into those three categories it will be easier to understand. First load the library that is needed to send data to a vendor. Then there is typically a function that sends a pageview on loading of the library. Then there will be another function that fires when an event happens. If you read the documentation or look at the custom code you will typically see this structure.
// used to load the analytics libarary in
createElement.('Some LONG code the creates a source script or iframe')

// tpyically some type of function that lets the vendor know your specific account ID
vendor.init("VENDOR-ID");

// used to send pageview information with extra data
vendor.sendPageView('pageview',
 {
  pageurl: '/woodchip-picker',
  name: 'billy'
 }
);

// used to track interactions like clicks, video views, scrolling, etc
vendor.sendEvent('event',
 {
  action: 'pick woodchips',
  label: 'from show',
  name: 'billy'
 }
);
All of these actions can be split up typically and stored in their own tag with a specific trigger. This helps a lot with understanding how data is being sent for each type of event.
Third Stage - Network Log
This is one of the most important steps, as it is where you will observe what data is being sent to a specific vendor. To access this, use the Network tab in the Developer Tools. Here you will be able to see all of the pixels / tracking calls that are being made to your marketing or analytics platforms. For example, you can see all calls being made to Adobe Analytics by searching for /ss in the search bar. Every tool has a specific URL structure that they use to receive data. Using the /ss search parameter, we see all of the calls made to Adobe Analytics. On the panel on the right, you will see the specific values that are being set for that call. Each tool has its own parameters that map to its own values. There are not many sources that document the parameters but for the most part, you are able to figure out what they are collecting.
Here is a list of common search patterns you can use to search for main tools.
- Adobe Analytics -
/ss - Google Analytics -
www.google-analytics.com/collect - Facebook -
https://www.facebook.com/tr/ - Twitter -
t.co - Snowplow -
/com.snowplowanalytics.snowplow - Google Ads -
doubleclickorgoogleads
On this tab you will want to make sure that all of your calls are going through. Some things to check for are:
- That a pageview is fired every time a page is loaded.
- If you are expecting an event to fire, look for those specific values.
- Ensure that all of the data elements are present that you believe should be there.
- Sometimes the data will be encoded in base64, you can use an extension to decode it or use this one online.
- The order of how the pixels load is also important, if an event is loading before a page-view it can affect how the data is aggregated and cause issues with reporting.
- Make sure the first pageview call has your campaign information, most likely stored in the URL parameters.
- If you can’t find the network calls you need, search for the specific ID for your account. Typically you will find it from that specific ID. For example, if your Google Analytics ID is GA-124212-34 you can find all network calls for that platform using that ID.
- If you are looking for form submissions you can search for
method: POSTto only look at calls that are sent with a POST protocol. - When looking at the Headers tab of each call you will generally see all your data points parsed out at the bottom. In order to understand what each variable gets mapped to, it requires some research on that specific vendor. Not all vendors will list out what there parameters are but you can typically take a best guest.
- If calls are too big, they sometimes get sent as a POST which will not get parsed in the Headers tab by Chrome. At that point I will copy the whole URL that sent the data and take it too a tool that parses query strings to extract those parameters.
- If you are seeing two pageviews or network calls for a specific vendor, check if another rule is loading another pageview. A majority of the time, there might be some code triggering another pageview or event call that you did not intend or there is another tool loading in a library that is outside of the tag manager.
Network Call Related Resources:
General Advice
When looking at the network tab, it is helpful to have the “Preserve log” button clicked this helps preserve all of then network calls as you are going from page to page. This section is not only useful for looking at tags for debugging, but it can also be helpful to understand how a website is built and get an understanding of how ALL data flows to and from it. I have specifically used this tab to monitor form submissions to validate hidden fields or just wondering what other websites are collecting with their forms.
Another not so white hat use of the network log is to look at other sites API sand how they transfer data around. If their authentication and CORS policy is not set up correctly it might be possible to access that API in a malicious manner. I have found a few endpoints that expose too much information about users and could potentially lead to data leaks. This is one of the ways hackers have found open end API endpoints and quietly extracted data from them. An example that I ran across was an event registration website that exposed all the email addresses of the people going to that event hosted on their site. I emailed them about that possible leakage and they shut down that endpoint within the day.
Every browser has some version of this if you want to test this in other browsers. If you don’t want to worry about browser specific you can use third party network sniffers to suck up all the data and monitor it there. I would recommend Charles Proxy or WireShark. I have used both and have found Charles Proxy easier to use. These tools will monitor ALL inbound and outbound network signals coming to that device.
If you need to monitor mobile app traffic, you will have to go through a few different steps. Here is a guide on how to connect to Android written by Tealium and here is another guide for iOS written by Charles Proxy.
If you want to monitor Android Mobile Chrome browser, you can use Remote Debugging. I have used this a few times to figure out if mobile sites were causing any issues with tagging. More often then not I have not found a significant difference when testing on my desktop browser and my mobile browser.
Although it is extremely helpful to learn how to use the network tab in the developer tools, there are plenty of analytics debuggers built as chrome extensions that make this much easier than parsing individual calls. I teach people first about the network tab and the functionality of it before I tell them about the debuggers because this leads to a strong understanding of the whole system in general. I will include a list of vendor specific debuggers and general debuggers at the bottom. An argument can be made for learning how to debug with both analytics debuggers and the network tab.
As you can see there are ALOT of way to monitor network traffic and alot of use cases for understanding how this works. I could write several whole blog post about the use cases for looking at this particular tab. As I have learned more about web development and technology, I have found my self always using this particular development tool to understand how things work. Often when I am researching for jobs, I will spend several hours going through the network logs of a website along with the code to understand the amount of effort that goes into how things are created. Often when code is understandable and built with strict purpose, I know that will be a place I want to work.
Fourth Stage - Platform Analytics
One of the final steps I will go through is the validation of data that goes into the systems you are collecting data in. It is important to keep in mind that no system collects data the same and there will always be differences between the systems. I will go over some observations I have seen when validating data against other systems. The main things to keep in mind is to look for similar trends between data. Each platform has its own schema for determining how data is aggregated.
General Observations:
- Each tool carries it own’s assumptions and will make different inference about the data. They will have different ways that it defines “visits” / “sessions” but for the most part a visit is all of the pageviews and events grouped together by some definitions. In Google Analytics, it is all hits with in a 30 minute time window but maybe on a mobile device the concept of a visit is defined by the whole days worth of activities.
- Another common issue is the aggregation of data. Simo has a great point where he pointed out that the front end data collection mechanisms do not have any notion of a “session” which can make it hard for an software engineer working on that implementation to understand that sending a certain event will cause that aggregation to be totally messed up, like an interaction event vs non-interaction event for Google Analytics.
- Sometimes when data is sent in an odd order, the analytics tool might not be able to back-propagate information to those previous data points. Say the user ID was set on the third or fourth network call. The first two rows of data will not be attached to that specific user ID making it hard to link those two specific calls to that user. This is why it becomes extremely important to understand how web analytics schemas work and possibly move into building your own.
- If you are going to compare data, try to use row level detail data. A pageview and event will look similar when comparing Google Analytics and Adobe Analytics when looking at the raw data. This can come from using BigQuery for Google Analytics or the Data Feed from Adobe Analytics. If you do not have access to BigQuery, you can sort of build the idea of row level detail data using the implementation described in this blog post by Philip Walton.
- If you have to compare records of some sort like form submissions or orders, use a a common order ID or transaction ID that is collected in both systems. This will make it much easier to determine what is missing and will help to identify why. Look at common data points between the too and try to understand if a certain browser or device is dropping orders. I have found more often than not, there was some type of race condition that prevented an order from being collected in the analytics system. If it appears to be random what orders are being dropped, it sadly has to be chalked up to how javascript can fail a thousand different ways.
- If you are trying to debug an exact experience, take the User ID or client ID you are collecting in the network calls and look up that user ID either in the UI or in the database to see exactly how those hits were processed. This can GREATLY help understand how a system processed information.
- Even though this might be a fruitless effort, I have also found it helpful to send the user ID that is generated from other systems to each other. It helps when trying to link those sessions and users together. Don’t spend to much time on this unless you are using it to link authenticated users by some type of ID. This sometimes helps in understanding the assumptions another system is making about the data as it is processed.
General Advice
Don’t go too deep on validating data between systems, there are just too many variations on how things work to give a great answer on why one system says this and another says that. Instead ,I would focus on the first three steps of this process, examine the data layer, the tag manager and the network calls. If those are working as expected you most likely will get clean data. The only time I would go deep on trying to validate data is for orders or transactions. These are generally the most important KPIs and requires the most accuracy. Alot of validation in this step is just thinking about the data logically. Does this make sense why data is appearing a certain way? If so let it be and focus on analysis instead of chasing the ghost of comparing systems.
Ending Thoughts
If you only remember a few things from this post, here is a basic over of the process I typically go through for validating digital analytics tags.
- Sanity check datalayer in the console.
- Look at tag manager code and see if it is throwing any errors. Use the tag manager debuggers to look at data elements and rule loading.
- Examine network logs for specific vendor tags or pixels.
- Validate that data has made it into your analytics platform either in real-time or check back after it has been processed.
Now all of this is obviously a manual process and is not that easy to do it at scale when you have alot of tags and a large website but understanding the basics of this will help you quickly debug problems when other systems have found issues. I would recommend checking some of the automated solutions I have posted below, those are generally 3rd party softwares the will crawl your site and simulate tags on a schedule to help catch when data looks inaccurate or site changes cause a shift in tag infrastructure. If you are more ingrained with your development team I would look more into unit testing and building test rights into your systems. Jan Exner has an excellent series on this, he talks about full frameworks that can be deployed alongside your code that can help catch errors early on. Having experience with each of them, I believe it is foundational that you learn how to do this manually before taking advantage of unit testing or automated solutions.
Vendor Specific Debuggers
- Adobe Experience Cloud Debugger
- Google Analytics Debugger
- Tag Assistant (Google)
- Facebook Pixel Helper
- Snowplow Analytics Debugger
- Tealium Tools
- Tagician: Adobe Launch & DTM Debugger
- GTM Sonar
All Around Debuggers
Helpful Chrome Extensions
- EditThisCookie - Allows quick access to the cookies on a site. Useful for look at primary user IDs stored in cookies.
- Base64 Encode and Decode - Encode and decodes base64.
- SelectorGadget - Helpful for looking at element and the CSS selector need to click identify certain elements.
- Tag Manager Injector - Helpful for injecting a instance of Google Tag Manager for testing.
Automated Solutions
Programmatic Solutions
Sources / Articles